Traders make millions with momentum
indicators. Here’s how.
トレーダーはモメンタム指標で数百万ドルを稼ぐ。方法は次のとおり。

Ishanrekhi
イシャンレキ
Oct 3, 2024
2024年10月3日
You’re standing on the shore of a beach on a hot sunny day. As you’re building your sand castle a big wave rushes in and destroys the whole thing!
暑い晴れた日に、あなたはビーチの海岸に立っています。砂上の楼閣を建てていると、大きな波が押し寄せ、全体を破壊します!
The momentum in the waves can increase with several surrounding factors like wind, temperature etc. Market momentum is similar as the wave of these prices comes in all different strengths, directions and movements. These movements are used to analyze markets and understand trends. The currents in the ocean are much stronger in the night, like certain market conditions cause big movements of prices and form trending areas.
波の勢いは、風、温度などのいくつかの周囲の要因によって増加する可能性があります。市場の勢いは、これらの価格の波がすべての異なる強さ、方向、動きで来るため、似ています。これらの動きは、市場を分析し、トレンドを理解するために使用されます。海流は夜になると、特定の市況が価格の大きな動きを引き起こし、トレンドエリアを形成するなど、はるかに強くなります。
Mastering market momentum allows traders to enable capitalizing on trends, predict reversals and manage risk effectively. It can also help traders mark support and resistance areas, similar to how far a wave would reach into the shore.
市場のモメンタムをマスターすることで、トレーダーはトレンドを利用し、反転を予測し、リスクを効果的に管理することができます。また、トレーダーがサポートエリアとレジスタンスエリアをマークするのにも役立ち、波が岸にどれだけ届くかに似ています。
If you were to tally how far a wave reached each time you would sure be able to come up with an average, expecting where it might go. This would save you from wrecking your magnificent build just like it would save traders from hitting their Stop-Loss. Momentum indicators work the same by measuring the rate of price change in a stock over a set period.
波が毎回どこまで到達したかを集計すると、波がどこに行くかを予想して、平均値を出すことができるはずです。これにより、トレーダーがストップロスに達するのを防ぐのと同じように、壮大な楼閣を台無しにすることからあなたを救うことができます。モメンタム指標は、一定期間の銘柄の価格変動率を測定することで同じように機能します。
Identifying the momentum of different markets can be done by countless indicators. This article will take a deep dive into Moving Averages, MACD (Moving Average Convergence
Divergence) and RSI (Relative Strength Index).
さまざまな市場の勢いを特定することは、無数の指標によって行うことができます。この記事では、移動平均、MACD(移動平均収束発散)、RSI(相対力指数)について詳しく説明します。
Moving Averages:
移動平均
The Basics
基本
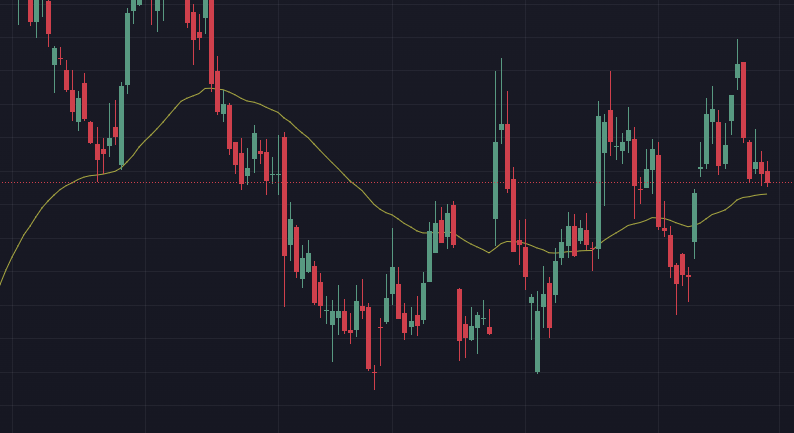
A moving average is a simple line that calculates the closing average from a set amount of pervious candles. Each candle the MA passes shows the average of the candles previous to it. A closing price higher than the given moving averages, means the stock is currently pricier than its previous time-frames/candles.
移動平均線は、一定量の浸透ローソク足から終値を計算する単純な線です。MAが通過する各ローソク足は、その前のローソク足の平均を示しています。終値が移動平均線よりも高い場合、株価は現在、以前の時間枠/ローソク足よりも割高であることを意味します。

This chart is set to the 50MA which calculates the average of the last 50 candles and orchestrates this amount in the form of a line. Each candle is one full day;(the line represents the average of the 50 days previous to it).
このチャートは50MAに設定されており、最後の50本のローソク足の平均を計算し、この量を線の形で調整します。各キャンドルは丸一日です。(線はそれ以前の50日間の平均を表す)
There is two types of moving averages which are the SMA and EMA. The SMA (simple
moving average) cancels out unnecessary noise, whereas the EMA (exponential moving average) is more responsive to small fluctuations in price
移動平均線には、SMAとEMAの2種類があります。SMA(単純移動平均)は不要なノイズを打ち消しますが、EMA(指数移動平均)は価格の小さな変動に対してより敏感に反応します
Recognizing Trends
トレンドの認識
The most popular Moving Averages are the 20/50/100/200 MA. Each average is used to determine the direction and trend of a market.
最も人気のある移動平均線は、20/50/100/200 MAです。各平均は、市場の方向性とトレンドを決定するために使用されます。
Larger moving averages represent long-term trends as they account for more previous data. Smaller moving averages are used to identify short-term trends, beneficial for day/swing trading. Techniques to recognize the different trends are listed below:
移動平均が大きいほど、過去のデータを多く占めているため、長期的な傾向を表しています。より小さな移動平均線は、短期的なトレンドを特定するために使用され、デイトレード/スイングトレードに有益です。さまざまな傾向を認識するための手法を以下に示します。
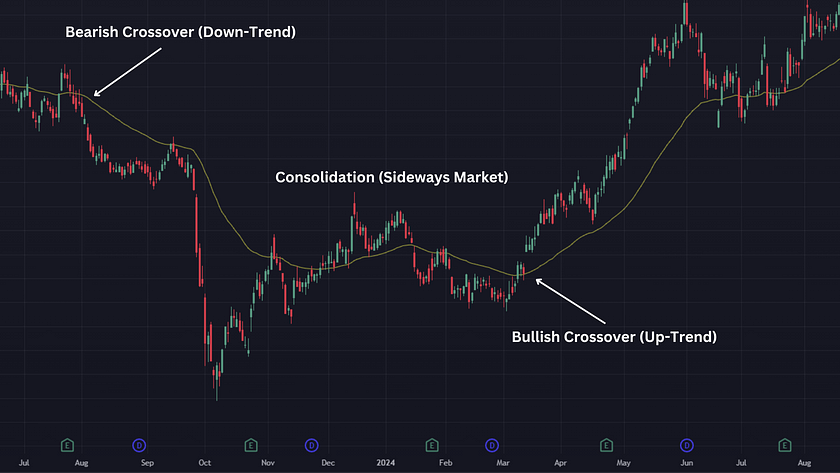
- Bullish/Bearish: If the MA is below the current candles it indicates the price is
headed to the incline as buyers have recently been putting more buying pressure than before (look for buying opportunities). If the MA is over the current candles it indicates the price is headed to the decline as seller have recently been putting more selling pressure than before (look for selling opportunities). The steepness of the line aligns
with the strength of the trend.
強気/弱気(Bullish/Bearish):移動平均線(MA)が現在のローソク足の下にある場合、それは価格が上昇傾向にあることを示します。これは、最近の買い手が以前よりも多くの買い圧力をかけていることを意味します(買いの機会を探す)。逆に、移動平均線が現在のローソク足の上にある場合、それは価格が下降傾向にあることを示します。これは、最近の売り手が以前よりも多くの売り圧力をかけていることを意味します(売りの機会を探す)。ラインの傾斜の度合いは、トレンドの強さに一致します。
- Consolidation: If the price is frequently crossing below and over the MA, it indicates
a sideways market. This often means that the number of buyers and sellers are equal. This market should only be traded in using swing highs and lows as entry points.
停滞:価格が頻繁に移動平均線(MA)の下や上をクロスしている場合、それは横ばい市場を示しています。これは、買い手と売り手の数が等しいことを意味することが多いです。この市場では、スイングハイおよびスイングローをエントリーポイントとして取引するのが望ましいです

Daily Chart | 50MA 日足チャート|50MA
Crossovers
クロスオーバー
You will often see traders using multiple moving averages at once. This is usually to spot crossovers which can result to entry signals and strong trends.
トレーダーが一度に複数の移動平均線を使用しているのをよく見かけます。これは通常、エントリーシグナルや強いトレンドにつながる可能性のあるクロスオーバーを見つけるためです。
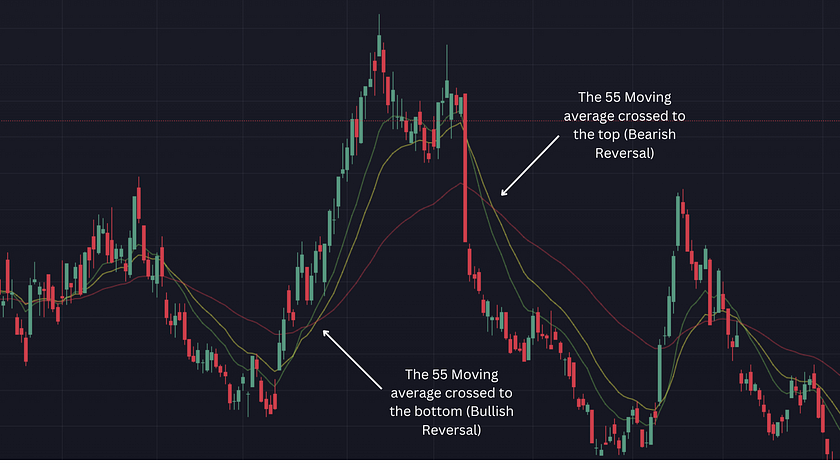
When using two or more moving averages the biggest MA crossing beneath the two smaller ones can signal a bullish reversal. This is simply due to the reason that a larger MA represents a long-term trend. When it crosses below smaller moving averages, it suggests that the recent price is becoming more bullish opening areas for buying opportunities. The opposite should be done when the biggest MA moves to the top as it means the trend has recently shifted to the decline.
2つ以上の移動平均を使用する場合、2つの小さな移動平均線の下にある最大のMA交差は、強気の反転を示す可能性があります。これは単に、より大きなMAが長期的なトレンドを表しているという理由によるものです。小さな移動平均線を下回ると、最近の価格が購入機会のより強気な開始エリアになっていることを示唆しています。最大のMAが上に移動する場合は、トレンドが最近下落にシフトしたことを意味するため、逆のことを行う必要があります。
Traders often add different moving averages while using the crossover strategy. A common and responsive sequence is the 13EMA, 21EMA, and 55EMA. The following scenario shows it being used in a real market.
トレーダーは、クロスオーバー戦略を使用しながら、異なる移動平均線を追加することがよくあります。一般的で応答性の高い配列は、13EMA、21EMA、および55EMAです。次のシナリオは、実際の市場で使用されていることを示しています。

55EMA = Red Line 55EMA=赤い線
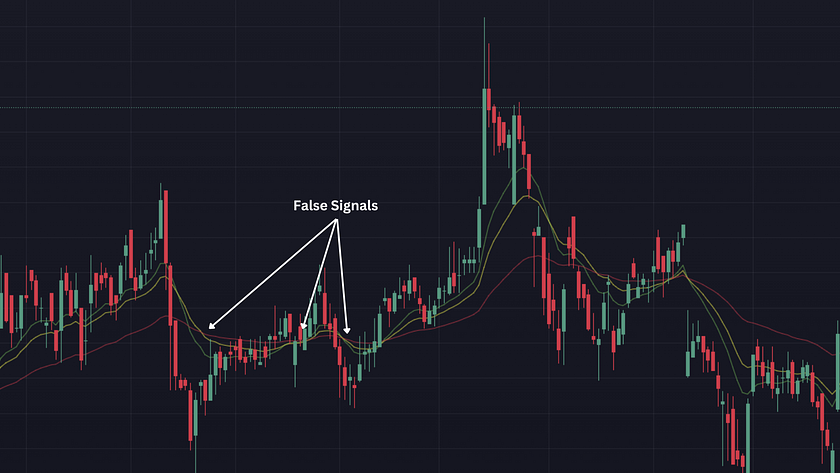
Moving averages are a reliable addition for trendy markets although they often have a very late
response causing the price to reverse back soon after an entry signal. This causes this indicators to give many false signals:
移動平均線は、トレンド市場にとって信頼できる追加要素ですが、多くの場合、応答が非常に遅く、エントリーシグナルの直後に価格が逆転します。これにより、この指標は多くの誤ったシグナルを発します。

55EMA = Red Line 55EMA=赤い線
The 55EMA crosses over and under the smaller averages multiple times with little to no change. Due to late responses moving averages turn out to be useless is consolidating
markets. Furthermore, MA crossovers shouldn't be used as the only indication while trading as they don’t represent market conditions and long term trends.
55EMAは、小さい方の平均値を何度も上回ったり下回ったりしますが、ほとんどまたはまったく変化がありません。応答が遅いため、移動平均線は役に立たないことが判明し、市場を統合しています。さらに、MAクロスオーバーは、市場の状況や長期的なトレンドを表すものではないため、取引中の唯一の指標として使用すべきではありません。
=============================
インターネット・コンピュータランキング
==============================
ネットサービスランキング
==============================
