RSI (Relative Strength Index):
RSI(相対力指数):
The Basics
基本
The Relative Strength Index measures the strength and speed of a trend. It can be very useful to spot big movements in price like reversals. It works by measuring the speed and change, orchestratingthis amount in a scale from 0 to 100. It swing back and forth between this scale symbolizing 0–30 is an oversold area and 70–100 as an overbought area. 30–70 is considered the normal zone and the price remains in this area for 90% of the time.
相対力指数は、トレンドの強さと速度を測定します。反転のような価格の大きな動きを見つけるのに非常に役立ちます。これは、速度と変化を測定し、この量を 0 から 100 のスケールで調整することで機能します。このスケールは、0 から 30 が売られ過ぎのエリアであり、70 から 100 が買われ過ぎのエリアであることを象徴するこのスケールの間を行ったり来たりします。30〜70は通常のゾーンと見なされ、価格は90%の時間このエリアに留まります。
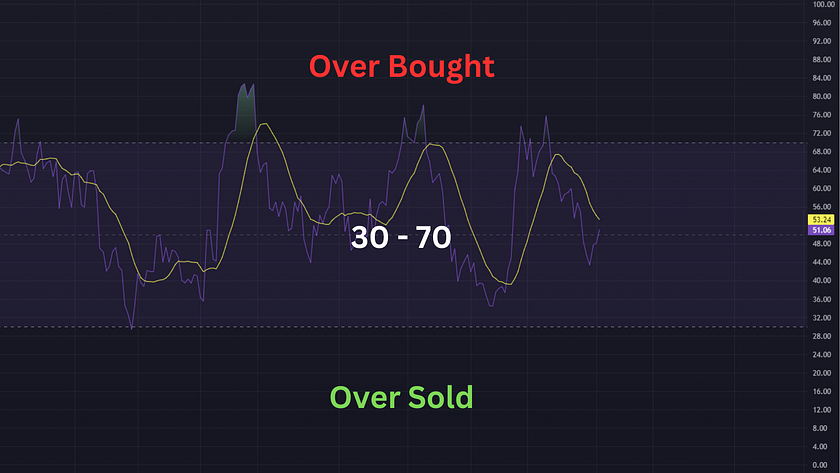
The yellow line is the 14SMA 黄色の線が14単純移動平均
The Over bought zone represents: amount of shares being purchased are extremely higher than the average. This means the amount of buyers in the market has increased severely. This creates an unstable market and can result in a heavy bearish trend. The same analogy is used in the Over sold zone. It indicates sellers have been dominating the market. This causes a high demand of buyers resulting in a bullish reversal.
買われ過ぎゾーンは、購入される株式の量が平均よりも極端に多いことを表します。これは、市場の買い手の数が大幅に増加したことを意味します。これにより、市場が不安定になり、強い弱気トレンドが発生する可能性があります。同じ類推が売られすぎ ゾーンで使用されます。これは、売り手が市場を支配していることを示しています。これにより、買い手の需要が高くなり、強気の反転が生じます。
Using this logic, traders would obviously be setting sell orders in the over bought region
and buy orders in the over sold region. While this strategy can often be very profitable, it isn't always the case! The price of a share can remain in these zones for extended periods of times,
indicating extremely powerful trend pressure.
このロジックを使用すると、トレーダーは明らかに買われ過ぎの領域で売り注文を設定し、売られ過ぎの領域で買い注文を設定します。この戦略はしばしば非常に有益ですが、常にそうであるとは限りません。株式の価格は長期間これらのゾーンに留まる可能性があり、非常に強力なトレンド圧力を示しています。
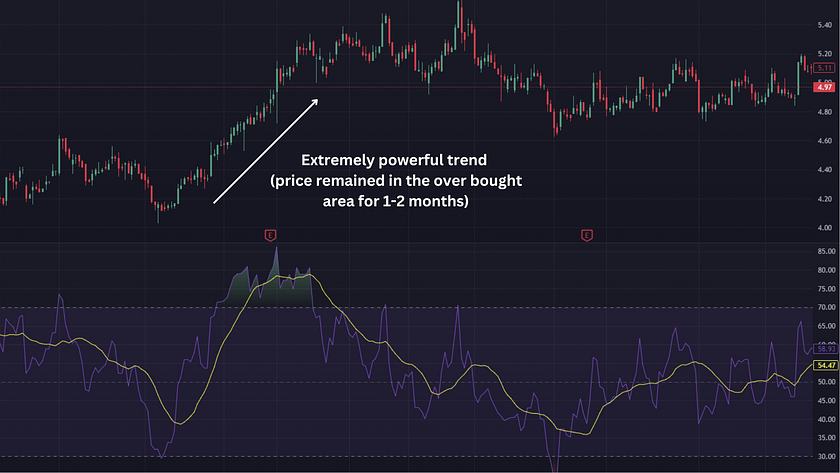
It is almost impossible to predict when the price will bounce back from the over bought and over sold areas.
価格が買われ過ぎと売られ過ぎのエリアからいつ跳ね返るかを予測することはほとんど不可能。
Crossovers
クロスオーバー
When using RSI crossovers are usually accurate even if it results in small price movements. Similar to the other two indicators, the trendier the market, the more accurate the indictor.
RSIを使用する場合、クロスオーバーは通常、たとえ小さな価格変動をもたらすとしても正確です。他の2つの指標と同様に、市場がトレンドであるほど、指標はより正確になります。
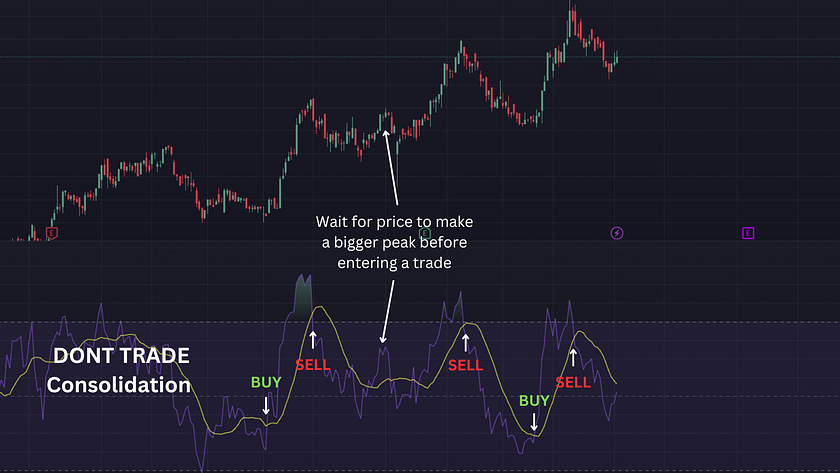
Crossovers using RSI are extremely simple. When the moving average crosses above the RSI line it sets a sell indication. When the moving average crosses below the RSI line it sets a buy indication. It’s highly recommended to only enter trades when the chart and indicator both show tall swing highs and short swing lows.
RSIを使用したクロスオーバーは非常に簡単です。移動平均線がRSIラインを上回ると、売りの兆候が設定されます。移動平均がRSIラインを下回ると、買いの兆候が設定されます。チャートとインジケーターの両方が背の高いスイングの高値と短いスイングの安値を示している場合にのみ取引を開始することを強くお勧めします。
Divergences In RSI
RSIの乖離
In traders eyes RSI is the best tool to spot divergence patterns. To recap; divergences occur when the chart and indicator are not in agreement. Divergences can be both bullish
and bearish. They often tend to represent longer term movements (1–5 weeks).
トレーダーの目から見ると、RSIは乖離パターンを見つけるのに最適なツールです。まとめると;乖離は、チャートとインジケーターが一致していない場合に発生します。ダイバージェンスは強気と弱気の両方になります。多くの場合、長期的な動き(1〜5週間)を表す傾向があります。
To spot divergences consider using the “RSI Divergence Indicator” rather than the standard. This indicator has an accurate reorganization of divergences. The length of the divergence line correlates with the strength of the reversal. Be aware that divergences in RSI and MACD are exactly the same, its just easier to spot them using RSI.
乖離を見つけるには、標準ではなく「RSI乖離インジケーター」の使用を検討してください。この指標は、乖離の正確な再編成を持っています。乖離線の長さは、反転の強さと相関しています。RSIとMACDの乖離はまったく同じであり、RSIを使用してそれらを見つけるのが簡単であることに注意してください。
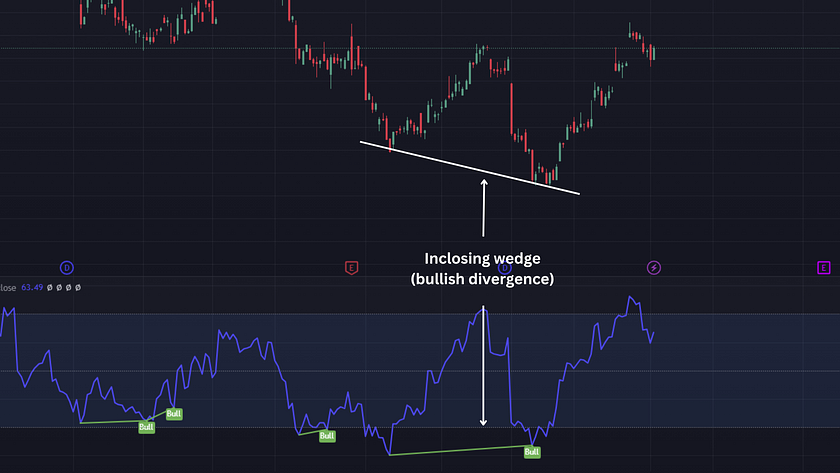
This is an example of a bullish divergence. The chart shoes a “lower low”, while the RSI line reads a “higher high”. The shape of these two lines forms an inclosing wedge and this
divergence causes a big uptrend.
これは強気の乖離の一例です。チャートは「安値を下げる」、RSIの線は「高値」を示しています。これらの2本の線の形状は、内向きくさびを形成し、この乖離は大きな上昇トレンドを引き起こします。
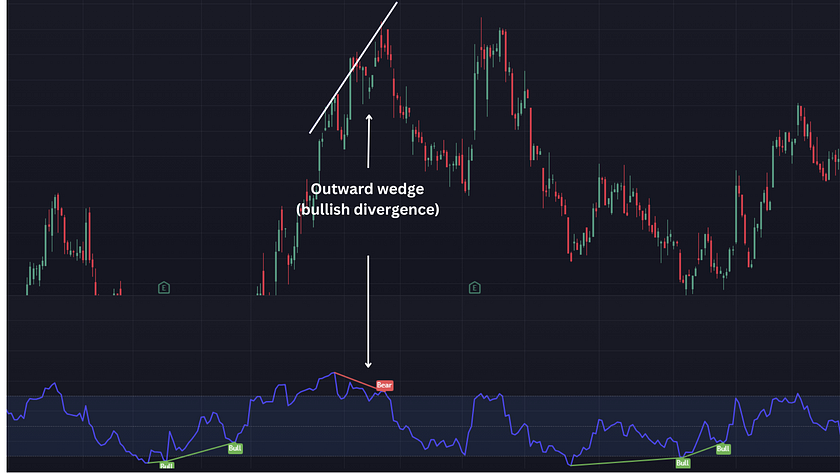
This is an example of a bearish divergence. The chart clearly shoes a “higher high”, while the RSI line reads a “lower low”. The shape of these two lines forms an outward wedge
and this divergence causes a big downtrend.
これは強気の乖離の一例です。チャートは「安値を下げる」、RSIの線は「高値」を示しています。これらの2本の線の形状は、外向きくさびを形成し、この乖離は大きな上昇トレンドを引き起こします。
Application:
アプリケーション
Hedge Funds
ヘッジファンド
SAC Capital was known for its aggressive trading strategies, including momentum trading. The fund often used technical analysis to identify stocks with strong upward or downward trends. Tracking momentum of markets allowed this fund to make profit; buying into the bullish markets and selling into bearish markets.
SAC Capitalは、モメンタム取引を含む積極的な取引戦略で知られていました。このファンドは、テクニカル分析を使用して、上昇トレンドまたは下降トレンドが強い銘柄を特定することがよくありました。市場の勢いを追跡することで、このファンドは利益を上げることができました。強気の市場に買いを入れ、弱気の市場に売ります。
On the other hand Long-Term Capital Management (LTCM) was another hedge fund that faced failure incorporating the same momentum strategies as SAC. Unfortunately, in 1998 Russia defaulted on its debt, causing market turmoil. This caused LTCM to face severe debt as most of their fundings were borrowed.
一方、LTCM(Long-TermCapital Management)も破綻に直面したヘッジファンドで、SACと同じモメンタム戦略を取り入れました。残念ながら、1998年にロシアは債務不履行に陥り、市場の混乱を引き起こしました。これにより、LTCMは資金のほとんどが借り入れられていたため、深刻な借金に直面しました。
What can we learn from this?
このことから何を学ぶことができるでしょうか。
Momentum indicators can be a very useful
tool while trading stocks, although they should never be used is
isolation. They perform better when paired to other techniques like
bullish patterns, support and resistances, the Fibonacci sequence etc. Have fun
making millions of dollars with your new knowledge and more importantly, don't
let the waves hit your sand castles!
モメンタム指標は、株式を取引する際に非常に便利なツールになりますが、孤立して使用しないでください。強気パターン、サポートラインとレジスタンスライン、フィボナッチ数列などの他の手法と組み合わせると、成績が向上します。あなたの新しい知識で何百万ドルも稼ぐのを楽しんでください、そしてもっと重要なことに、あなたの砂上の楼閣を波に打たせないでください!
Stock Market
株式市場
Trading
取引
Trading Indicator
取引指標
Momentum Investing
モメンタム投資
Written by Ishanrekhi
文責:イシャンレキ

Hey, everyone. I'm very passionate about investing and finance. If you want to learn more, check out my articles.
皆さん、こんにちは。私は投資と金融にとても情熱を注いでいます。もっと詳しく知りたい方は、私の記事をご覧ください。
=============================
インターネット・コンピュータランキング
==============================
ネットサービスランキング
==============================
