4. Morning star: Three-candle bullish reversal pattern after a downtrend
4. モーニングスター:下降トレンド後の3本のローソク足の強気の反転パターン
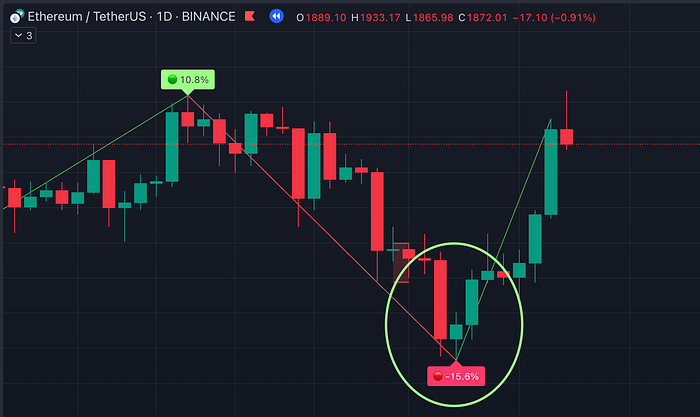
The fourth bullish candlestick pattern is the morning star. This pattern is formed when a long red candle is followed by a small green candle that gaps up and then a larger green candle that closes above the midpoint of the previous day’s candle. The morning star pattern is a strong bullish signal, indicating that buyers have taken control of the market and are likely to push prices higher.
4番目の強気のローソク足パターンは明けの明星です。このパターンは、長い赤いローソク足の後に、ギャップのある小さな緑のローソク足が続き、次に前日のローソク足の中点より上で閉じる大きな緑のローソク足が続くときに形成されます。明けの明星パターンは強い強気のシグナルであり、買い手が市場を支配し、価格を押し上げる可能性が高いことを示しています。

Morning Star Candlestick on Ethereum | TradeDots
イーサリアムの明けの明星ローソク足 |トレードドット
5. Bullish harami: Two-candle pattern after a downtrend
5. 強気のハラミ:下降トレンド後の2本のローソク足パターン
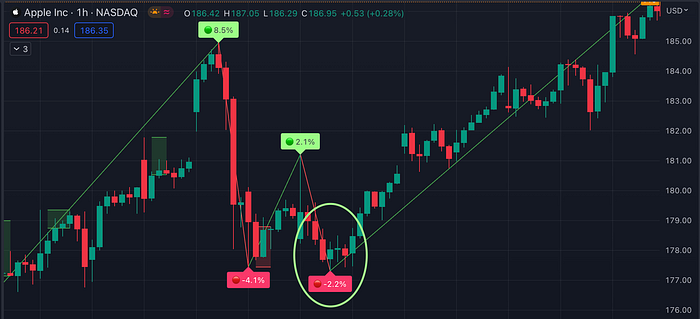
The fifth bullish candlestick pattern is the bullish harami. This pattern is formed when a long red candle is followed by a smaller green candle that opens and closes within the body of the previous day’s candle. The bullish harami pattern is a bullish reversal signal, indicating that buyers have stepped in to push prices higher after a period of selling.
5番目の強気のローソク足パターンは強気のハラミです。このパターンは、長い赤いローソク足の後に、前日のローソク足の実体内で開閉する小さな緑のローソク足が続くときに形成されます。強気のハラミパターンは強気の反転シグナルであり、買い手が売り期間の後に価格を押し上げるために介入したことを示しています。

Bullish Harami Candlestick on $AAPL | TradeDots
$AAPLの強気のはらみローソク足 |トレードドット
6. Three white soldiers: Three long bullish candles reversal pattern
6. 3つの白い兵士:3つの長い強気のローソク足の反転パターン
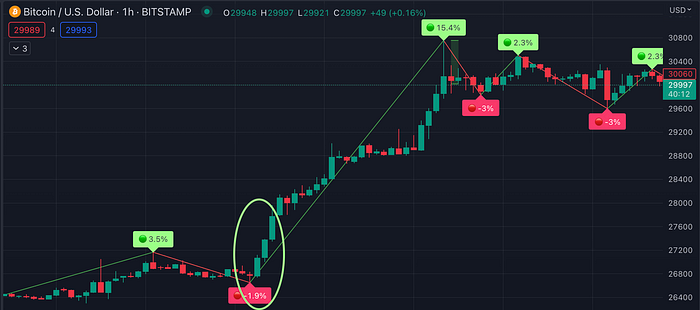
The sixth and final bullish candlestick pattern is the three white soldiers. This pattern is formed when three consecutive green candles are formed, each with a higher close than the previous candle. The three white soldiers pattern is a strong bullish signal, indicating that buyers have taken control of the market and are likely to push prices higher
6番目で最後の強気のローソク足パターンは、3つの白い兵士です。このパターンは、3つの連続した緑のローソク足が形成され、それぞれが前のローソク足よりも高い終値を持つときに形成されます。3つの白い兵士のパターンは強い強気のシグナルであり、買い手が市場を支配し、価格を押し上げる可能性が高いことを示しています

Three White Soldiers Candlestick on Bitcoin | TradeDots
ビットコインの3人の白い兵士のローソク足|トレードドット
Wrap up
まとめると
In conclusion, understanding bullish candlestick patterns is an essential skill for traders looking to identify potential upward trends in the market. The six patterns discussed in this blog — hammer, bullish engulfing, piercing line, morning star, bullish harami, and three white soldiers — are all strong bullish signals that indicate a potential reversal or continuation of an upward trend.
結論として、強気のローソク足パターンを理解することは、市場の潜在的な上昇トレンドを特定しようとしているトレーダーにとって不可欠なスキルです。このブログで取り上げた6つのパターン(金槌、強気の包み込み、切り込み線、明けの明星、強気のハラミ、3つの白い兵士)は、いずれも上昇トレンドの反転または継続の可能性を示す強力な強気シグナルです。
However, it is important to remember that no trading strategy is foolproof, and traders should always exercise caution and use risk management techniques to protect their investments.
ただし、確実な取引戦略はなく、トレーダーは常に注意を払い、リスク管理手法を使用して投資を保護する必要があることを覚えておくことが重要です。
About TradeDots
トレードドッツについて
TradeDots is a TradingView buy/sell indicator that identifies market reversal patterns through the implementation of quantitative investment strategies based on price actions and market patterns. We are now providing a 25% off and a 7-day FREE Trial for our newly subscribed users.
トレードドッツは、価格行動と市場パターンに基づく定量的投資戦略の実施を通じて市場の反転パターンを特定するTradingViewの売買指標です。現在、新しく登録したユーザーには、25%オフと7日間の無料トライアルを提供しています。
You can even set up your personalized trading alerts using our Telegram Bot, so you can now trade effortlessly without the need to constantly monitor your screen. Sign up now to experience TradeDots across all trading assets!
テレグラムボットを使用して個別化された取引アラートを設定することもできるため、画面を常に監視することなく簡単に取引できるようになりました。今すぐサインアップして、すべての取引資産でトレードドッツを体験してください!
Disclaimer:
免責事項
The information provided in this article is for educational purposes only and should not be considered as financial advice. Trading involves risk, and it is important to conduct thorough research and seek professional guidance before making any investment decisions.
この記事に記載されている情報は教育目的のみを目的としており、金融アドバイスと見なされるべきではありません。取引にはリスクが伴うため、投資決定を下す前に徹底的な調査を行い、専門家の指導を求めることが重要です。
Technical Analysis
テクニカル分析
Bullish Signal
強気の信号
Trading
取引
Ethereum
イーサリアム
Tradingview Indicator
取引景観指標
=============================
インターネット・コンピュータランキング
==============================
ネットサービスランキング
==============================
