
BTC price prediction and market cap/trading volume: Token Terminal
BTCの価格予測と時価総額/取引量:Token Terminal
Active addresses and traders
アクティブなアドレスとトレーダー
If you look at the active address chart of the Bitcoin network, an interesting trend surfaces. As of 2024, the active address count seems to be dipping, which might signify a holding pattern.
ビットコインネットワークの活発なアドレスチャートを見ると、興味深いトレンドが浮かび上がってきます。2024年現在、アクティブアドレス数は減少しているようですが、これは保有パターンを示しているのかもしれません。

Bitcoin price prediction and active address count: Bitinfocharts
ビットコインの価格予測と活発なアドレス数:Bitinfocharts
This might not be the most bullish signal instantly. However, if seen with a rising trading volume, we can expect some fireworks post-halving as users are holding and not selling immediately. The BTC that is moving is only led by the traders.
これはすぐに最も強気のシグナルではないかもしれません。しかし、取引量の増加を見ると、ユーザーがすぐには売らずに保有しているため、半減期後に花火が上がることが予想されます。動いているBTCは、トレーダーによって主導されるだけだからです。
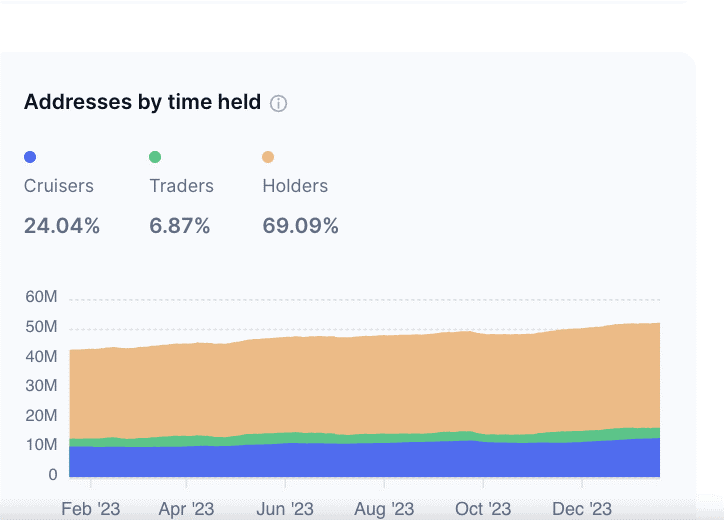
BTC price prediction and holders: CoinMarketCap
BTCの価格予測と保有者:CoinMarketCap
To supplement this hypothesis, here is the Bitcoin holding pattern reported by CoinMarketCap. As you can see, holders comprise over 69% of the addresses, which explains the drop and a bullish outlook.
この仮説を補足するために、CoinMarketCapによって報告されたビットコインの保有パターンがこちらにあります。ご覧の通り、ホルダーはアドレスの69%以上を占めており、これが下落と強気の見通しを説明します。
Other metrics
その他の尺度
Bitcoin halving is almost here, and how can we not talk about the miners? As of mid-January 2024, BTC miners are actively selling, which might indicate the need to prepare for the halving.
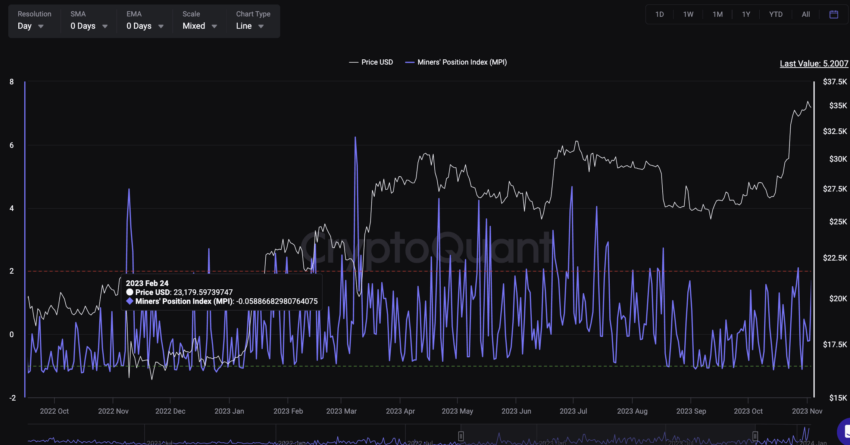
Bitcoin price prediction and Miner’s Position Index: CryptoQuant
ビットコインの価格予測と採掘者のポジションインデックス:CryptoQuant
These rapid sell-offs are keeping the prices in check, so it might not be an alarming sign in the medium to long term. Here is a tweet on the miner outflow.
これらの急速な売りは価格を抑制しているため、中長期的には憂慮すべき兆候ではないかもしれません。こちらに採掘者の流出に関するツイートがあります。
Kashif Raza
カシフ・ラザ
@simplykashif
Bitcoin miners moving lots of BTC to exchanges. Data shows miner outflows hitting a 6-year high, sending over $1 billion worth of BTC to exchanges. Source: CryptoQuant
ビットコイン採掘者が大量のBTC を取引所に移動しています。データによれば、採掘者の流出は6年ぶりの高水準に達し、10億ドル以上のBTCが取引所に送られた。 出典:
CryptoQuant

It is worth noting that MPI, or the Miner’s Position Index, is a more reliable indicator as it takes the total miner outflow and finds a ratio with the 365-day average, yielding more accurate results.
MPI(採掘者ポジションインデックス)は、採掘者の流出量の合計を取り、365日平均との比率を見つけるため、より信頼性の高い指標であり、より正確な結果が得られることは注目に値します。
Also, if you have been worried about the miners offloading assets, here is a bit about the miner revenue and Bitcoin NFTs:
また、採掘者が資産を売却することを心配している場合は、採掘者の収益とビットコインNFTについて少し説明します。
“Not worried about halving & miners’ revenue. I expect BTC will more than double in USD terms in the 12-16 months following, offsetting the drop in subsidy. Also still think inscriptions probably go on a 2021-NFT style run this cycle. Expect these to trade much
higher.”
"半減と採掘者の収益については心配していません。BTCはその後12〜16か月で米ドルベースで2倍以上になり、補助金の減少を相殺すると予想しています。また、碑文はおそらくこのサイクルで2021年のNFTスタイルで実行されると思います。これらははるかに高く取引されることを期待してください。」
Will Clemente, co-founder of Reflexivity Research: X
ウィル・クレメンテ、リフレクシビティ・リサーチの共同創設者:X
Despite the price hike over the past few months, note that Bitcoin dominance is slightly tilted in favor of altcoins. This could be a reason why the second-in-line Ethereum has been having a field day across exchanges in mid-January.
過去数か月の価格上昇にもかかわらず、ビットコインの優位性はアルトコインにわずかに傾いていることに注意してください。これが、2番目にランクインしているイーサリアムが1月中旬に取引所全体でフィールドデーを開催している理由かもしれません。
Besides the mentioned metrics, you can also look at the Bitcoin futures and options space
to get a more granular, price-related view. For instance, if the BTC futures prices trade higher than the spot prices, you can see a bullish trend coming in. This is termed Contago, and the bearish or rather the opposite version of it is termed Backwardation. In the options market, a high Put/Call ratio can hint at a bearish sentiment, with Put options being
those that bet on the price of BTC going down.
上記の指標に加えて、ビットコイン先物とオプションのスペースを見て、より詳細な価格関連のビューを取得することもできます。例えば、BTC先物価格がスポット価格よりも高く取引されている場合、強気のトレンドが入ってくるのがわかります。これはコンタゴと呼ばれ、弱気、またはむしろその逆のバージョンはバックワーデーションと呼ばれます。オプション市場では、高いプット/コール比率は弱気のセンチメントを示唆する可能性があり、プットオプションはBTCの価格が下がることに賭けるオプションです。
10x Research
10倍調査
@10x_Research
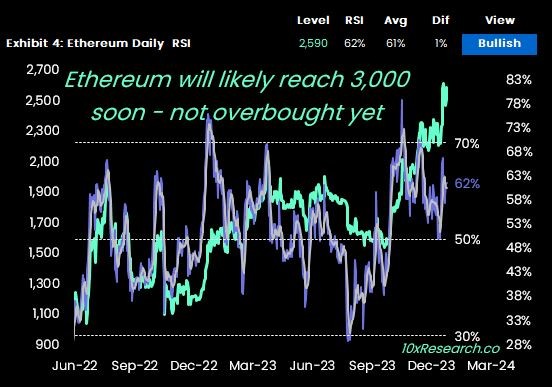
Why Ethereum Will Climb Above 3,000 Soon
イーサリアムがまもなく3,000 を超える理由
1-11) Open interest share in perp futures has remained flat for BTC (41.6% on Jan 1 vs.
41.1% now), while ETH’s share of open interest has increased from 21.8% to
26.5%.
1-11) 永久先物におけるBTCの未決済建玉共有は横ばい(1月1日の41.6%に対して現在は41.1%)である一方、ETHの未決済建玉共有は21.8%から26.5%に増加した。
2-11) While the technical indicators are stretched for Bitcoin, Ethereum's technical setup is
very different, with the weekly relative strength index still rising. More importantly, the indicator has room to run.
2-11) ビットコインのテクニカル指標は伸びていますが、イーサリアムのテクニカル設定は非常に異なり、週次相対力指数は依然として上昇しています。さらに重要なのは、指標に上昇の余地があることです。
3-11) Read more here: https://reports.10xresearch.co/p/ethereum-will-climb-3000-soon… #EthereumETF #Ethereum #Bitcoin #BitcoinETF
3-11) 詳細はこちら: https://reports.10xresearch.co/p/ethereum-will-climb-3000-soon…
#EthereumETF #Ethereum #Bitcoin #BitcoinETF
Plus, the presence of Bitcoin on other ecosystems as wrapped tokens and comparison with other PoW assets like Litecoin and more can also contribute to its future price action.
さらに、ラップドトークンとして他のエコシステムにビットコインが存在することや、ライトコインなどの他のPoW資産との比較も、将来の価格行動に貢献することができます。
Bitcoin (BTC) price prediction and technical analysis
ビットコイン(BTC)の価格予測とテクニカル分析
Before we explore the broader price-based technical analysis, it is important to track the short-term view. Let us now take the BTC/USDT daily chart and explore further:
価格ベースのテクニカル分析を幅広く検討する前に、短期的な視点を追跡することが重要です。次に、BTC/USDTの日足チャートを取り、さらに詳しく見ていきましょう。
Short-term BTC analysis
短期間BTC分析
BTC might be in for a deeper correction, courtesy of the dropping RSI or, rather, momentum. This could be due to the miners offloading their holdings at a clip.
BTCは、RSIの下落、というよりはモメンタムのおかげで、より深い修正を受けるかもしれません。これは、採掘者が持ち株を一度に売却したことが原因である可能性があります。

BTC price prediction short-term: TradingView
BTC価格予測短期: TradingView
As for the pattern, a rising wedge is evident, and the price candles are steadily moving towards the lower trendline. As of Jan. 19, 2024, the $40,692 level is acting as a strong support.
If it gets breached, BTC might drop down to $35,000 in quick time.
パターンに関しては、上昇ウェッジが明らかであり、価格のローソク足は着実に下降トレンドラインに向かって動いています。2024年1月19日現在、40,692ドルの水準が強力なサポートとして機能しています。それが破られた場合、BTCはすぐに35,000ドルに下落する可能性があります。
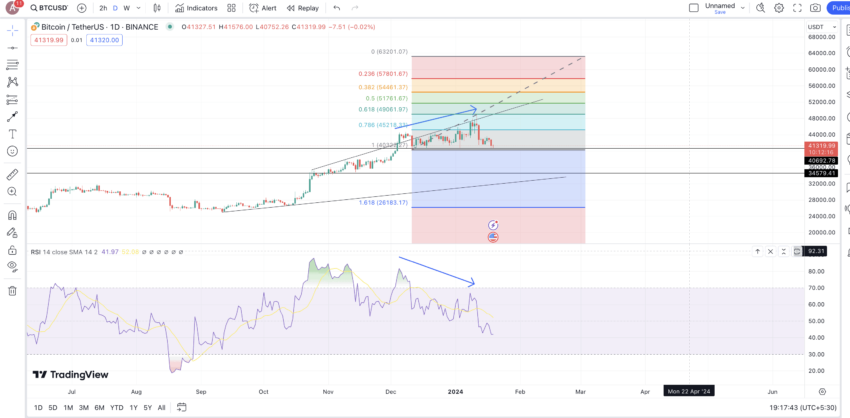
BTC price prediction and key levels: TradingView
BTC価格予測と主要レベル: TradingView
But then, if the RSI improves and BTC somehow breaks past the upper trendline of the wedge, invalidating the bearish trend, the immediate level to aim for would be $45,218.33.
This level coincides with the 0.786 point of the Fib indicator.
しかし、その後、RSIが改善し、BTCが何らかの形でウェッジの上部トレンドラインを突破し、弱気トレンドを無効にした場合、目指すべき当面のレベルは45,218.33ドルになります。このレベルは、フィボナッチインジケーターの0.786ポイントと一致します。
Here is what might quickly change the narrative:
こちらには、物語がすぐに変わる可能性のあるものがあります。
Let us now move to the weekly analysis, determining a broader pattern of sorts.
次に、週次分析に移り、より広範なパターンを決定しましょう。
Weekly chart analysis of Bitcoin
ビットコインの週次チャート分析
Let us now head over to Bitstamp for the BTC/USD trading pair. If we zoom out, an interesting trend surfaces. Historical analysis suggests an A-to-F-type pattern for BTC, with A being the first high, C being a lower high, and E being a higher high. There are higher lows in play
— B, D, and F.
次に、BTC / USD取引ペアのBitstampに向かいましょう。ズームアウトすると、興味深いトレンドが浮かび上がります。過去の分析では、BTCのAからFへのパターンが示唆されており、Aが最初の高値、Cが低値、Eが高値となっています。プレーには、B、D、Fという高いローがあります。
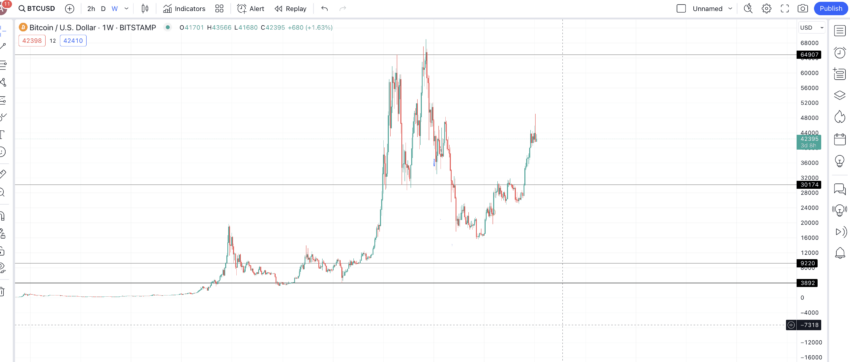
BTC price prediction weekly levels: TradingView
BTC価格予測の週次レベル: TradingView
=============================
インターネット・コンピュータランキング
==============================
ネットサービスランキング
==============================
